Give it some time to load!
Exploring Swiss Exports Product Complexity:
Visualizing Harvard’s Growth Lab Product Complexity Index in a new way.
Product Data narrative with dynamic visualizations for web.
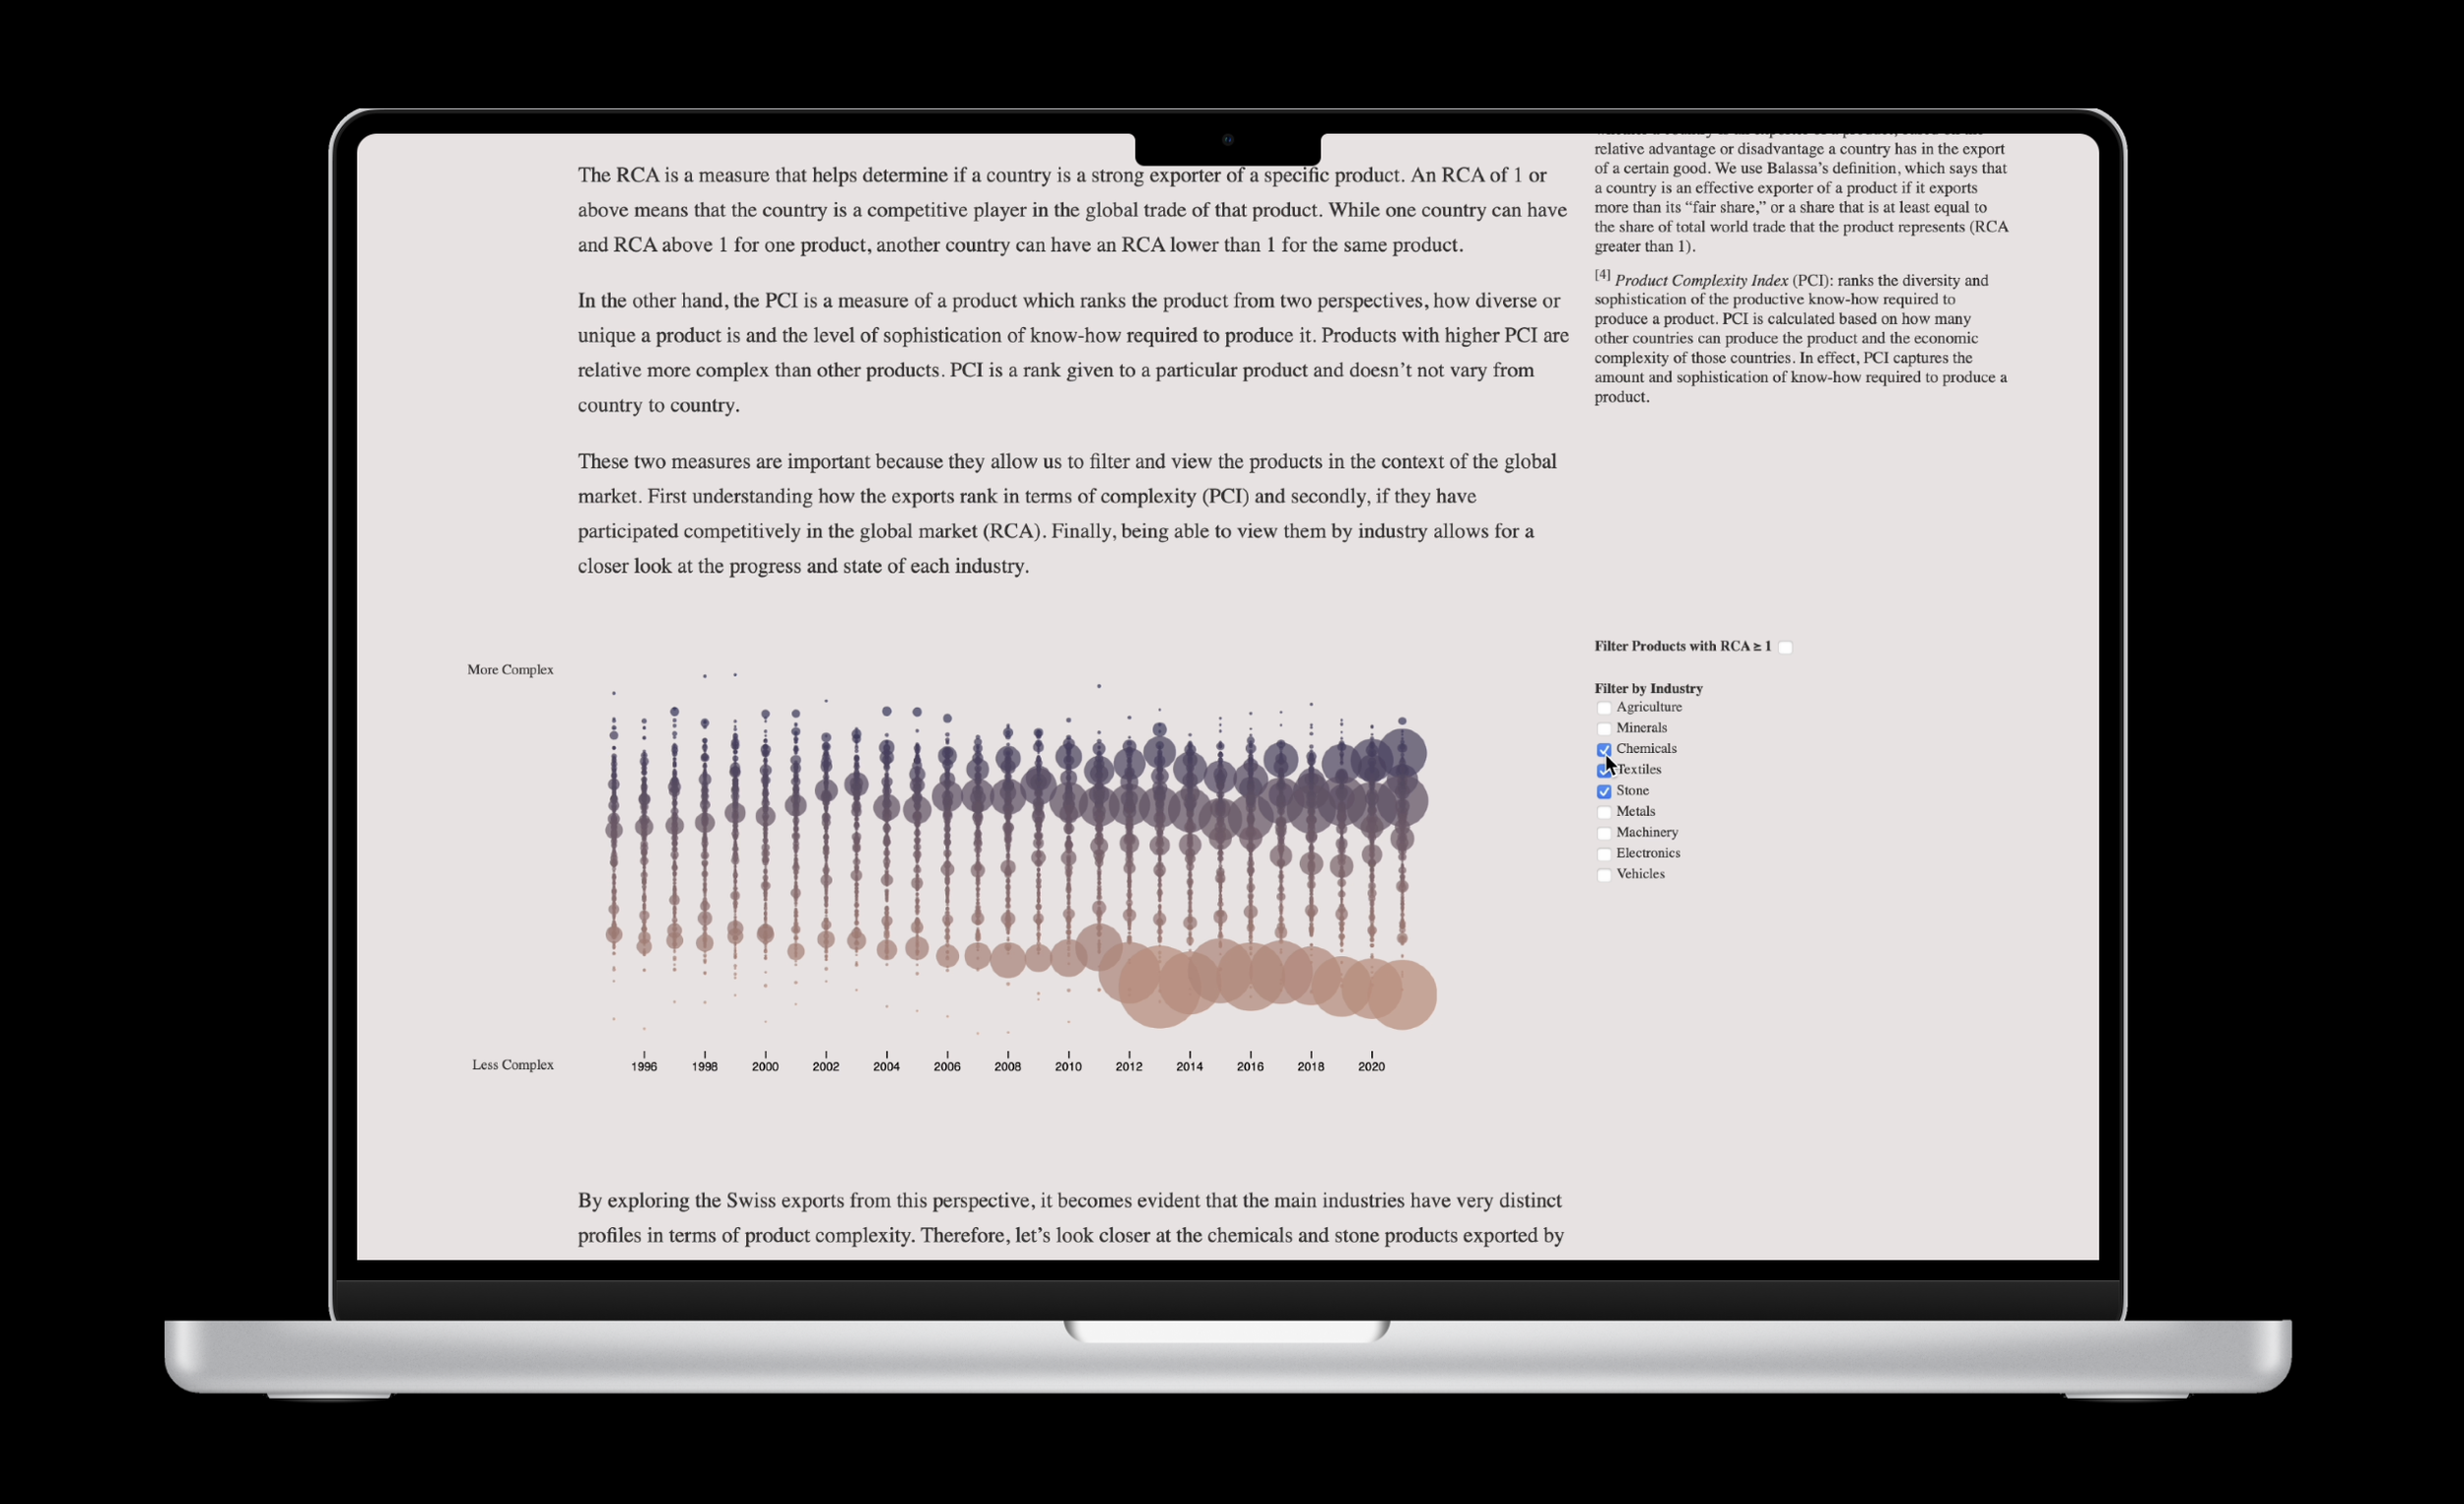
Content Multiple dynamic visualizations threaded into a narrative to help the audience explore Swiss export trends and their complexity index.
Tools
Adobe Illustrator
Visual Studio Code
HTML, CSS, D3
Excel
Project Overview
Switzerland is a high-income country, ranking among the wealthiest nations per capita. According to analysis by The Growth Lab at Harvard University, Switzerland holds the second spot in the Economic Complexity Index (ECI) Ranking among 133 countries. The ECI measures the diversity and complexity of a country's export portfolio.
Despite this commendable position, Switzerland's ranking has remained stagnant for a decade, coinciding with a decline in export diversification. The Swiss economy is projected to experience sluggish growth, with The Growth Lab forecasting an annual growth rate of 2.1% over the next decade, placing Switzerland in the lower ranks globally.
The purpose of this project was to provide a nuanced understanding of Switzerland's economic landscape and to communicate insights that could inform decision-making for a broad range of stakeholders, including economic experts and the voting population. The goal is to make complex information accessible to those interested in influencing and driving Switzerland's economic future.
We took on the challenge of translating The Growth Lab’s complex analysis into visualizations that prioritized clarity and simplicity. Our design featured multiple dynamic visualizations embedded within a linear narrative. A crucial design element was introducing a new method of displaying the relationship between the Product Complexity Index (PCI) and export trends to facilitate an intuitive understanding of Switzerland's economic complexity trends. Additionally, we included filtering options for the Revealed Comparative Advantage (RCA) index to provide deeper insights.
“Some solutions require us to embrace complexity, while others shine through simplicity. Both can achieve significance”
This project was the final deliverable for an academic course in the MFA in Information Design and Data Visualization. It was a team effort, marking the first time both team members integrated HTML, CSS, and D3. My contribution focused on data processing and visualizations.
